Archive | SaaS RSS feed for this section

Earn While Doing What You Love

7 Dec

When I was in high school I had the good fortune to earn a spot on the Jones Beach Lifeguard Corps. It was a job that was every bit as fun as it sounds, and because we were unionized state employees, it paid decently too. Our days involved sitting on the lifeguard stand every other hour, staring intently at our patch of ocean, followed by an hour off, during which we were encouraged to exercise, take out the surf lifeboats, or “patrol” the sand. I remember commenting to one of the grizzled veterans several decades my senior that “I would do this job for free.” He looked at me with a knowing eye, tinged with the pitying look of a chess player who knows they are at least two moves ahead of you, “but the thing is kid, they do pay us to do this.” Those summers were an early lesson in the harmony of getting paid for doing something you truly love.

Because I am passionate about entrepreneurship and software, I am still earning a living doing what I love, as an early stage technology venture capitalist. For many people, however, neither business nor technology sparks joy. For them, teaching yoga, or fitness, or cooking, or magic, or art, or you-name-it, is what they love. Being chained to a laptop with seven browser tabs open so they can create email campaigns, manage customer lists, process payments, and balance their business accounts, is at best a necessary evil to enable them to earn income pursuing their passion.  

The aforementioned state of affairs has long held, but in March of 2020 Covid19 threw a curveball at small businesses everywhere, but especially those dependent on serving clients face to face. All of a sudden small business owners needed to go virtual by figuring out how to use Zoom, accept online payments, and hopefully make up some of their lost revenue by serving a potentially bigger, geographically dispersed audience. And for the employees of these small businesses, many of them saw their work hours shrink, or faced painful furloughs. For some of these employees, however, necessity led them to branch out on their own, serving clients directly through video conferencing, with neither the limitations nor safety net of working for someone else. Add to the mix countless others who saw the opportunity to turn their personal hobby into an income producing “side hustle” as virtual services quickly went mainstream.

Enter Luma, a startup founded, quite appropriately, by two engineers who had* only ever met over video conference. In March 2020, Dan and Victor quickly saw the need to help solopreneurs, small businesses, and groups invite people to virtual events, accept payments, and manage customer relationships. They applied their skills as full-stack programmers to quickly launch an MVP, which met with quick success. Because Zoom was designed primarily for business meetings and webinars, Luma saw an opportunity to leverage Zoom for many other use cases by enabling customizable event pages, CRM and membership management, subscriptions, payments, and easily understandable analytics for event hosts. Luma has been used for hosting fitness classes, magic shows, cooking classes, writers workshops, live podcasts, PTA speaker series, and a myriad of other activities. The list of future features, use cases, and target user segments grows longer everyday.

While Dan and Victor were quick to jump into action with Luma back in April, now that Zoom has become a verb they are hardly the only ones to see the need for a virtual event platform. What drew me to invest in these two founders, however, is their incredible ability to get stuff done, their high bar for quality and customer service, and their relentless intellectual curiosity driving them to best understand how to improve the lives of their users, so that hosts and guests alike can spend more time doing what they love, while the fiddly bits of technology and managing a business become nearly invisible. 

One great example of Dan and Victor’s commitment to customer centricity was the following. One evening a few months ago I was about to log on to a parent education event hosted by Common Ground Speaker Series. What I soon realized was that I had failed to pre-register and so I was missing the appropriate Zoom link. I found a live chat help button, not knowing whether anyone from Common Ground would actually be there at this late hour, and lo and behold Victor pops up in the chat within seconds and immediately works behind the scene with the event host to get my registration accepted so I could receive the link. Victor himself was providing live support to an event host at the end of a day filled with coding new features, working on strategic planning, creating marketing campaigns, recruiting team members, and donning dozens of other hats as a startup founder does. All that, and I’ve never seen either Victor or Dan without a huge smile on their faces. Luma’s founders embody the commitment, optimism, and truth seeking that great founders embrace, which is ultimately why we invested in them, and are so excited for the journey ahead. Luma helps people earn a living doing what they love. I am fortunate to earn my living helping great founders like Dan and Victor.


* Dan has since relocated to San Francisco and the two founders are now bubble-mates working together shoulder to shoulder.

To Measure Sales Efficiency, SaaS Startups Should Use the 4×2

6 Jan

Once you’ve found product/market fit, scaling a SaaS business is all about honing your go-to-market efficiency. Many extremely helpful metrics and analytics have been developed to provide instrumentation for this journey. LTV (lifetime value of a customer), CAC (customer acquisition cost), Magic Number, and SaaS Quick Ratio, are all very valuable tools. The challenge in using derived metrics such as these, however, is that there are often many assumptions, simplifications, and sampling choices that need to go into these calculations, thus leaving the door open to skewed results.

For example, when your company has only been selling for a year or two, it is extremely hard to know your true Lifetime Value of a Customer. For starters, how do you know the right length of a “lifetime”? Taking 1 divided by your annual dollar churn rate is quite imperfect, especially if all or most of your customers have not yet reached their first renewal decision. How much account expansion is reasonable to assume if you only have limited evidence? LTV is most helpful if based on gross margin, not revenue, but gross margins are often skewed initially. When there are only a few customers to service, COGS can appear artificially low because the true costs to serve have not yet been tracked as distinct cost centers as most of your team members wear multiple hats and pitch in ad hoc. Likewise, metrics derived from Sales and Marketing costs, such as CAC and Magic Number, can also require many subjective assumptions. When it’s just founders selling, how much of their time and overhead do you put into sales costs? Did you include all sales related travel, event marketing, and PR costs? I can’t tell you the number of times entrepreneurs have touted having a near zero CAC when they are just starting out and have only handfuls of customers–which were mostly sold by the founder or are “friendly” relationships. Even if you think you have nearly zero CAC today, you should expect dramatically rising sales costs once professional sellers, marketers, managers, and programs are put in place as you scale.

One alternative to using derived metrics is to examine raw data, less prone to assumptions and subjectivity. The problem is how to do this efficiently and without losing the forest for the trees. The best tool I have encountered for measuring sales efficiency is called the 4×2 (that’s “four by two”) which I credit to Steve Walske, one of the master strategists of software sales, and the former CEO of PTC, a company renowned for their sales effectiveness and sales culture. [Here’s a podcast I did with Steve on How to Build a Sales Team.]

The 4×2 is a color coded chart where each row is an individual seller on your team and the columns are their quarterly performance shown as dollars sold. [See a 4×2 chart example below]. Sales are usually measured as net new ARR, which includes new accounts and existing account expansions net of contraction, but you can also use new TCV (total contract value), depending on which number your team most focuses. In addition to sales dollars, the percentage of quarterly quota attainment is shown. The name 4×2 comes from the time frame shown: trailing four quarters, the current quarter, and next quarter. Color coding the cells turns this tool from a dense table of numbers into a powerful data visualization. Thresholds for the heatmap can be determined according to your own needs and culture. For example, green can be 80% of quota attainment or above, yellow can be 60% to 79% of quota, and red can be anything below 60%. Examining individual seller performance in every board meeting or deck is a terrific way to quickly answer many important questions, especially early on as you try to figure out your true position on the Sales Learning Curve. Publishing such “leaderboards” for your Board to see also tends to motivate your sales people, who are usually highly competitive and appreciate public recognition for a job well done, and likewise loathe to fall short of their targets in a public setting. 

Sample 4×2 Chart

Some questions the 4×2 can answer:

Overall Performance and Quota Targets: How are you doing against your sales plan? Lots of red is obviously bad, while lots of green is good. But all green may mean that quotas are being set too low. Raising quotas even by a small increment for each seller quickly compounds to yield big difference as you scale, so having evidence to help you adjust your targets can be powerful. A reasonable assumption would be annual quota for a given rep set at 4 to 5 times their on-target earnings potential.

Trendlines and Seasonality: What has been the performance trendline? Are results generally improving? Was the quarter that you badly missed an isolated instance or an ominous trend? Is there seasonality in your business that you have not properly accounted for in planning? Are a few elephant sized deals creating a roller-coaster of hitting then missing your quarterly targets?

Hiring and Promoting Sales Reps: What is the true ramp time for a new rep? You’ll see in the sample 4×2 chart that it is advised to show start dates for each rep and indicate any initial quarter(s) where they are not expected to produce at full capacity. But should their first productive quarter be their second quarter or third? Should their goal for the first productive quarter(s) be 25% of fully ramped quota or 50%? Which reps are the best role models for the others? What productivity will you need to backfill if you promote your star seller into a managerial role?

Evaluating Sales Reps: Are you hitting your numbers because a few reps are crushing it but most are missing their numbers significantly? Early on, one rep coming in at 400% can cover a lot of sins for the rest of the team. Has one of your productive sellers fallen off the wagon or does it look like they just had a bad quarter and expect to recover soon? Is that rep you hired 9 months ago not working out or just coming up to speed? 

Teams and Geographies: It is generally useful to add a column indicating the region for each rep’s territory and/or their manager. Are certain regions more consistent than others? Are there managers that are better at onboarding their new sellers than others?

Capacity Planning: Having a tool that shows you actual rep productivity and ramp times gives you the evidence-based information you need to do proper capacity planning. For example, if you hope to double sales next year from $5M ARR to $10MM, how many reps do you need to add–and when–based on time to hire, time to ramp, and the percentage of reps likely to hit their targets? Too few companies do detailed bottoms up planning at this level of granularity, and as a result fail to hit their sales plans because they simply have too few productive reps in place early enough.

There are many other questions the 4×2 can shed light on. I find it especially helpful during product/market fit phase and initial scaling. We tend to spend a few minutes every board meeting on this chart, with the VP Sales providing voice over, but not reciting every line item. As your team gets larger and the 4×2 no longer fits on one slide, it might be time to place the 4×2 in the appendix of your Board deck for reference. 

One question often asked about implementing the 4×2 is what numbers to use for the current and next quarter forecasts? If your sales cycles are long, such as 6 months, then weighted pipeline or “commits” are good proxies for your forward forecasts. In GTM models with very short cycles, it will require more subjective judgement to forecast a quarter forward, so I recommend adding a symbol such as ↑, ↔, or ↓ indicating whether the current and forward quarter forecast is higher, lower, or the same as the last time you updated the 4×2. Over time you’ll begin to see whether your initial forecasts tend to bias too aggressively or too conservatively, which is a useful thing to discover and incorporate into future planning.

There are lots of ways to tweak this tool to make it more useful to you and your team. But what I like most about it is that unlike many derived SaaS metrics, the 4×2 is based on very simple numbers and thus “the figures don’t lie.” 


To Measure Sales Efficiency, SaaS Startups Should Use the 4×2 was originally published on TechCrunch‘s Extra Crunch.

Source: https://techcrunch.com/extracrunch/

Why I Fell for Nightfall AI

7 Nov

Four years ago I met a recent Stanford grad named Isaac Madan. He had an impressive computer science background, had founded a startup in college, and was interested in venture capital. Though we usually look to hire folks with a bit more experience under their belt, Isaac was exceptionally bright and had strong references from people we trusted. Isaac joined Venrock and for the next two years immersed himself in all corners of technology, mostly gravitating towards enterprise software companies that were utilizing Artificial Intelligence and Machine Learning. Isaac packed his schedule morning, noon, and night meeting with entrepreneurs, developing a deep understanding of technologies, go-to-market strategies, and what makes great teams tick. Isaac was a careful listener, and when he spoke, his comments were always insightful, unique, and precise. Within a year, he sounded like he had been operating in enterprise software for over a decade.

After two years in venture, Isaac got the itch to found another startup. He paired up with a childhood friend, Rohan Sathe, who had been working at Uber. Rohan was the founding engineer of UberEats, which as we all know, grew exceptionally fast, and today generates over $8Bn in revenue. Rohan was responsible for the back-end systems, and saw firsthand how data was sprayed across hundreds of SaaS and data infrastructure systems. Rohan had observed that the combination of massive scale and rapid business change created significant challenges in managing and protecting sensitive data. As soon as they teamed up, Isaac and Rohan went on a “listening tour,” meeting with enterprise IT buyers asking about their business priorities and unsolved problems to see if Rohan’s observations held true in other enterprises. Isaac and I checked in regularly, and he proved to be an extraordinary networker, leveraging his contacts, his resume, and the tenacity to cold call, conducting well over 100 discovery interviews. Through these sessions, it was clear that Isaac and Rohan were onto something. They quietly raised a seed round last year from Pear, Bain Capital Ventures, and Venrock, and started building.

Nightfall founders 11-04-2019 v2[2][1].png
Founders of Nightfall AI: Rohan Sathe (left) and Isaac Madan (right)

One of the broad themes that Isaac and I worked on together while at Venrock was looking for ways in which AI & ML could re-invent existing categories of software and/or solve previously unresolvable problems. Nightfall AI does both. 

On the one hand, Nightfall (formerly known as Watchtower) is the next generation of DLP (Data Loss Prevention), which helps enterprises to detect and prevent data breaches, such as from insider threats–either intentional or inadvertent. DLPs can stop data exfiltration and help identify sensitive data that shows up in systems it should not. Vontu was one of the pioneers of this category, and happened to be a Venrock investment in 2002. The company was ultimately acquired by Symantec in 2007 at the time that our Nightfall co-investor from Bain, Enrique Salem, was the CEO of Symantec. The DLP category became must-have and enjoyed strong market adoption, but deploying first-generation DLP required extensive configuration and tuning of rules to determine what sensitive data to look for and what to do with it. Changes to DLP rules required much effort and constant maintenance, and false positives created significant operational overhead. 

Enter Nightfall AI. Using advanced machine learning, Nightfall can automatically classify dozens of different types of sensitive data, such as Personally Identifiable Information (PII), without static rules or definitions. Nightfall’s false positive rate is exceptionally low, and their catch rate extremely high. The other thing about legacy DLPs is that they were conceived at a time when the vast majority of enterprise data was still in on-premise systems. Today, however, the SaaS revolution has meant that most modern businesses have a high percentage of their data on cloud platforms. Add to this the fact that the number of business applications and end-users has grown exponentially, and you have an environment where sensitive data shows up in a myriad of cloud environments, some of them expected, like your CRM, and some of them unexpected and inadvertent, like PII or patient health data showing up in Slack, log files, or long forgotten APIs. This is the unsolved problem that drew Isaac and Rohan to start Nightfall. 

More than just a next-gen DLP, Nightfall is building the control plane for cloud data. By automatically discovering, classifying, and protecting sensitive data across cloud apps and data infrastructure, Nightfall not only secures data, but helps ensure regulatory compliance, data governance, safer cloud sharing and collaboration, and more. We believe the team’s impressive early traction, paired with their clarity of vision, will not only upend a stale legacy category in security but also usher in an entirely new way of thinking about data security and management in the cloud.This open ended opportunity is what really hooked Venrock on Nightfall.

Over the past year, Nightfall has scaled rapidly to a broad set of customers, ranging from hyper-growth tech startups to multiple Fortune 100 enterprises, across consumer-facing and highly-regulated industries like healthcare, insurance, and education. In our calls with customers we consistently heard that Nightfall’s product is super fast and easy to deploy, highly accurate, and uniquely easy to manage. Venrock is pleased to be co-leading Nightfall’s Series A with Bain and our friends at Pear. After 21 years in venture, the thing that I still enjoy most is working closely with entrepreneurs to solve hard problems. It is all the more meaningful when I can work with a high potential young founder, from essentially the beginning of their career, and see them develop into an experienced entrepreneur and leader. I am thrilled to be working with Isaac for a second time, and grateful to be part of Nightfall’s journey.

Predictions for 2016: Self-Driving Trucks, AI, and Brain Monitoring

8 Jan

This post originally appeared on Xconomy here.

Whether we have been in a tech bubble or not is frankly not that interesting. What is interesting is that the foundation for innovation is as strong as we’ve ever seen and entrepreneurs are bringing the future to reality at an amazing pace. Here are a few of my predictions for what we’ll see in 2016:

1. Self-driving vehicles hit the road for real, led by commercial trucks on interstate highways. So far most conversations around self-driving cars focus on personal vehicles. It’s unlikely we’ll take a fully autonomous car for our daily commute for quite a few years, but commercial trucking will see self-driving vehicles emerge far sooner. One company, Peloton, is already making this a reality. Long haul trucking is an easier technical challenge because interstates are generally straight lines, well-marked, digitally mapped in high definition, and generally free of pedestrians, bicycles, and other random obstacles; and the economic productivity of trucks can justify substantial investment in sophisticated cameras, sensors, and computers needed for autopilot systems. The economic need for autonomous trucks is huge due to the high cost and shortage of drivers, regulatory limits on driving time, and the fuel efficiency gained from convoys travelling close together in peloton formation.

2. Artificial intelligence will improve by leaps and bounds, and so will the way we interact with it. At first Siri frustrated us with its faults, and Google Now annoyed us with random cards on our screen, but I’ve noticed that recently both systems have gotten much broader and more accurate. Most of us barely scratch the surface in terms of their capabilities. In 2016 we will become more accustomed to interacting with AI systems of all kinds that are more natural, comfortable, and intelligent. Just as it took time for us to get used to self-checkout stations at the grocery store and the early days of voicemail were profoundly awkward, societal norms will need to adjust, and designers will need to create better user experiences for us to accept without pause that we’re interacting with an AI system and not a human. As we get better at these interactions, the AI technology gets smarter. Our digital assistant will ask nuanced questions (e.g. “did you mean the fruit or the company?”) to ensure it’s answering correctly. Smarter AI will enable automation of the rote components across a huge spectrum of jobs categories including dietary/fitness training, customer service, financial advice, education, and medicine, freeing up humans to focus on the most value added components of these occupations. As our expectations for human to computer interactions continue to grow, AI systems will rise to the challenge.

3. Wearable brain-monitoring devices for mindfulness training will become mainstream. It’s rare to see a person without a smartphone glued to his or her hand in almost any setting these days, though many people are becoming aware of the downsides of digital addiction and its effect on mental and physical health and our relationships. Couple this with growing public interest in meditation, yoga, and digital detox, and we’ll see mindfulness training become front and center in 2016 in wearable device form. Wearable fitness devices like the Fitbit or Apple Watch have become part of everyday life and early pioneers in this space have developed devices to monitor brainwaves, such as the Muse Brain Sensing Headband. The irony of a digital device helping with meditation and mindfulness may make you cringe, but brain training is hard and feedback essential and self-quantification of progress almost impossible until recently. Brain wave sensing devices will improve as our awareness and need for them grows, and they’ll soon become as mainstream as heart rate monitors.

Regardless of what the financial markets do in 2016, innovation will continue at fever pitch and cool new products and technologies will become newly indispensable parts of our work and lives.

Why Beckon Beckoned to Me: The Arrival of Marketing Performance Management

27 Jan

Beckon 1

In today’s online and mobile world customers are educating themselves about products and services long before any flesh and blood sales persons utters a word. Consumers can easily find their own way to detailed product information, user reviews, professional reviews, demonstration videos, user generated unboxing videos, sales rankings, price comparisons, social media sentiment, buying guides, and more. For this reason, marketing is more important than ever and the Chief Marketing Officer has never been more powerful nor controlled more budget, for both media and technology.

At the same time, however, the job of a marketing leader has never been harder or more stressful. The digital landscape has become so vast and dynamic that the marketer must master an endless parade of new channels. Just as they were getting used to Facebook, Twitter, and Instagram, along comes Pinterest and SnapChat, and undoubtedly the next hot channel is just around the corner. With an expanding universe of marketing channels comes an ever increasing volume of data. With all this data available, CMOs are expected to quantify their results with the precision of a CFO. While each new channel begets a host of new adtech and marketing tools to help the CMO manage campaigns, measure performance, and optimize results, each of these solutions produces data and reports in their own unique format.

Beckon 2

It has gotten to the point that when the CEO asks “how is our marketing doing?” it strikes fear in the heart of the CMO. This perfectly benign question usually kicks off an all-night exercise of cutting and pasting data and charts from various marketing execution systems into a lengthy presentation to answer the CEO’s question. When PowerPoint (now in its 28th year) is the tool of choice for marketers to aggregate and translate performance data from their various systems you know the situation is dire. Making matters even worse is the fact that many large brands can’t even access their own campaign data as it is held hostage by their various marketing agencies. Not only does the client get charged a markup by the agency for report requests, but it’s the classic case of the “fox guarding the henhouse” to ask an agency to report on their own performance.

Several years ago, a former marketing leader from a Venrock portfolio company did a stint as an Entrepreneur-In-Residence in our offices. She identified this lack of a single “CMO dashboard” integrating data from various point solutions as a problem she had experienced firsthand. Essentially she wanted a “System of Record” for marketing. After several months of researching potential technical solutions she concluded that, despite the crying need for such a product, building one would be too difficult. She gave up frustrated and joined another best of breed marketing tool company. This unsolved problem stuck in my head.

A few years later I met Beckon. The team at Beckon have been marketers, built marketing point tools, worked in agencies, and have built, installed and used systems of record in other enterprise functional domains such as finance and sales. Having seen the problems facing modern marketers firsthand they have taken a novel approach to building a system which can pull in data from over 100 different marketing point tools. While some of this data is available via well supported APIs, much of the data comes in via spreadsheet imports and email parsing (think TripIt.)   The next thing Beckon does is normalize the data so that marketers can compare different campaigns across different channels with one common taxonomy. They allow the marketing team to add metadata such as geographies or regions, product names or categories, customer segments, agencies, objectives, and so on, in order to put the marketing results in appropriate context. They allow for What If analysis, planning, and time series tracking. Beckons creates beautiful visualizations and answers to plain English questions that don’t require analysts skilled in SQL queries. And because this is not a BI tool, but rather an application built “by marketers, for marketers”, it is loaded with best practices for omni-channel marketing performance management right out of the box with no IT Department involvement.

Beckon 3

Over the past year some of the best brands in the world have adopted Beckon. Coke, Microsoft, GAP, and BSkyB are among the clients using Beckon to manage their omnichannel marketing. The real sweet spot for Beckon are mass marketers and indirect sellers who spend across at least five different channels. While I have written about my keen interest in predictive and intelligent software, the truth is that relevant, advanced modeling is only possible if the data sets the models are built on are comprehensive, normalized and continuously updated. Finance, for example, measures its performance according to GAAP (Generally Accepted Accounting Principles), a consistent, agreed-upon methodology shared within and across companies. As a result, we can understand a company’s financial performance quarter to quarter and compare performance to other companies in a standardized way. Marketers have never had a similar system. That’s what Beckon finally brings to marketing – a strong, united data foundation upon which all kinds of consistent, robust marketing analyses can flow – benchmarking, planned versus actuals, test and control, lift over baseline calculations, econometric (mix) models and more. Beckon gives marketers self-serve access to many of these analyses within its application and can also flow its standardized, merged and continuously updated data sets to advanced analytics teams and tools.

Marketing can finally have its own system of record the way sales has Salesforce, manufacturing has SAP, Finance has Oracle, and HR has Workday. Beckon is Marketing Performance Management. Finally the CMO does not have to hide when the CEO calls (or beckons) them to their office.

Beckon 4

The Future of Software is…Wicked Smaaht

18 Apr

smarter software

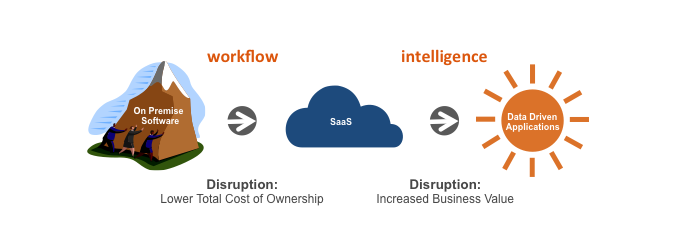
Software as a Service and cloud computing has been transformational for the software industry.  But compared to what is coming next, you ain’t seen nothing yet.  First, to appreciate where we are heading a quick review of where we’ve been is in order.  Back in the olden days of business software a software company sold you an application which you installed on your servers and desktops which made business processes more efficient, facilitated workflow, and sped up information retrieval.  As you used it this software accumulated data such as your customer records, financial results and manufacturing statistics.  If you wanted to deeply analyze this data for trends and insights you bought Business Intelligence or Analytics packages from a different set of software vendors so you could slice and dice your data, generate reports for executives, and hopefully decipher interesting trends about your business that you would then go act on.  In the early 2000s Software-as-a Service companies emerged and enabled you to “rent” business applications, rather than buy them, as your employees accessed them through the Internet and their web browsers.  This came with many advantages in total cost of ownership and manageability, but fundamentally most of the first SaaS applications were about workflow and data storage/retrieval just like their on-premise software forefathers.  In the last few years we’ve had a “Big Data” explosion and a host of new open source technologies like Hadoop, MapReduce, and Cassandra packaged by a set of new companies that help businesses manage and manipulate their ever expanding mountains of data.  Also emerging is a new generation of cloud based analytics companies that make it easy to slice, dice, and visualize big data sets.

So what’s the point of this history lesson?  The point is that, for the most part, all of these business applications and more recent Big Data tools have left the burden of capturing real business insight, making decisions, and taking action on the business customers themselves.  In essence, if you wanted real business value you had to create that value yourself by getting your employees to use the applications (which often means manual data input), have analysts mine and interpret the data, and ask managers and executives to make decisions based on what they see in the reports and charts.  For example, if your company used Sales Force Automation, whether it be Siebel on premise or Salesforce.com in the cloud, your sales reps had to diligently input data about their sales calls and management had to be smart about logging in to read the reports, suggest actions for each account and discern broader trends across the data.  A new breed of software company is emerging, however, that combines data science expertise with deep understanding of business problems.  I call them Data Driven Solutions.  These solutions use algorithmic data mining, not only on your own data but often on external third party data sets accessible by cloud ecosystems and APIs.  Data Driven Solutions make predictions about business functions, prescribe what to do next, and in many cases take action autonomously.  Trained analysts are not required to query databases but rather business users get answers directly from the software.  These answers typically feed seamlessly into the flow of business activity, often invisibly.  While this distinction may seem subtle, I believe it is fundamental and disruptive, and represents the future of software.  This is in no way the end of the SaaS, but in fact where SaaS is going next and presents massive opportunity to new SaaS innovators and a potential threat to incumbents who do not adapt.

Data Driven Solutions

8 Suggestions for Building Data Driven Applications

Think Moneyball, for everything.  Billy Beane of the Oakland A’s defied the conventional wisdom of traditional baseball talent scouts by recruiting players other teams underappreciated but whom he believed represented great return on investment.  He did this not by relying on his own brilliant sense of which players to recruit but by letting a math whiz run regression analysis on player statistics to figure out which lesser heralded stats were most predictive of winning baseball games.  The math predicted results and told him which players to acquire, predictions which Beane followed to his team’s competitive advantage.  Opportunities to apply this approach in business are practically everywhere.  6Sense* is a new SaaS company that analyzes B2B website traffic and third party data to predict which prospects are most likely to buy from you, what they will buy, when they will buy, and how much they will buy.  Like Beane, they don’t rely on rules of thumb in scoring prospects, such as whether the prospect downloaded a white paper, viewed lots of product detail webpages, or has “Procurement” in their job title.  6Sense has found that these heuristics yield only about 50% accurate forecasts which is not enough to compel a sales person to trust the results.  Instead, 6Sense uses a variety of machine learning statistical models to uncover the unexpected correlations which drive predictive accuracy up to 85-90% accuracy which definitely gets a sale rep’s attention.   Instead of being a chore to use like Sales Force Automation, 6Sense tells sales reps how to close more deals and earn more commissions.  Infer, Lattice, and C9 are also innovating in the area of predictive CRM solutions.  Use your domain expertise to figure out what problems to solve for your customers, but let the data lead to new and unexpected insights.

Build in Data Learning Loops   Google enjoys a very powerful form of Network Effect.   The more searches they run and resultant clicks they see the better they understand the intent of what a searcher wanted to find.  This makes their search algorithms better which earns them more user searches, which keeps the search quality/volume flywheel spinning.  This notion of a “learning loop” can be applied to many business settings as long as you find a way to “close the loop” and see how your prediction or answer actually fared.  For example, AppNexus* is an AdTech company that operates an exchange where publishers and ad networks on one side are matched by algorithms with advertisers and agencies on the other side to put the right ad in front of the right audience at the right time.  Learning loops are built in to the bidding and optimization algorithms which get the chance to learn from their results more than a billion times per day.  Data Learning Loops are powerful sources of competitive advantage akin to natural monopolies for those who achieve greatest scale.

Don’t Just DescribePredict and Prescribe   Some may ask whether Data Driven Solutions are just a new name for Business Intelligence.  I don’t think so.  Analytics packages mostly describe what is happening by sorting and filtering your data to show sums and averages and trend lines in tabular or graphical format.  Data Driven Solutions go much further by using the data to make predictions and even prescribe or execute actions.  A good example is the retail industry and Point of Sale results.  POS data is the basket by basket, sku by sku, store by store sales results that are collected across hundreds of thousands of retail outlets daily.  Nielsen has been compiling this data for decades and batch processes data sets for retailers and their vendors to study on a monthly basis.  How those vendors and retailers derive value from the data is up to them.  Retail Solutions* is a data driven solutions company which also gets POS data from retailers and shares it with vendors, but on a near real-time or daily basis.  More important than freshness of the data, however, is that Retail Solutions offers predictions and prescribes actions as solutions to business problems.  RSI doesn’t just create reports, they predict when you will be out of stock on a given SKU and sends mobile alerts to shop clerks, distributors and store managers to make sure the shelves stay full.  This is one of over ten predictive and prescriptive applications they provide in order to maximize return on investment for their customers.  Pretty charts are not enough.

Data is not the point, Focus on Solutions   Lots of companies market themselves as “Big Data” companies, but unless you are selling to IT Departments whose problems actually include managing lots of data, most business customers don’t really care about data.  They care about solving business problems.  Athenahealth* helps doctors get paid faster.  Turns out cashflow is really important to doctors and as a result Athena has grown very quickly and is now one of the largest SaaS companies.  Doctors don’t care how Athena actually does what they do, which happens to involve statistical analysis of massive amounts of insurance claims data and heavy use of learning loops.  The team at Athena deeply understands healthcare and doctors and so astutely markets themselves as a complete solution to real problems, and resist pounding their chest about how smart they are at Big Data.  In fact, the word “data” does not appear even once on their homepage.  Smart move.

Horizontal Strategy: Solve New Problems in New Ways   Providing applications for horizontal business functions like sales, finance, or human resources that function similarly across many industries represents very large opportunities because the market sizes are huge.  As a result there are powerful SaaS incumbents, such as Salesforce.com, Netsuite, and Workday, in each of these functional domains.  As you would expect, these players are starting to add data driven application intelligence to their offerings.  Fortunately for startups the challenges businesses face are constantly changing thus creating opportunities to be the first to solve new problems with a new approach.  In the realm of marketing, for example, “Content Marketing” is the hottest new trend and is the digital marketing approach seeing the greatest increase in budget allocation.  Yet marketers are highly confused as to what content to produce, how to produce it, where and how to distribute it, and especially how to measure ROI.  Captora is a young startup that has jumped on this new problem with data and domain expertise and is seeing rapid growth and using their head start to establish a beachhead before direct competition comes at them.  Knowing the experience of the team they won’t be resting on the side of the road but rather racing ahead to broaden their solution in synch with new challenges facing modern marketers.

Vertical Strategy: Feed the Starving   Providing deep solutions in specific industry verticals like healthcare, entertainment or education can be a huge opportunity.  This is especially true in industries where data has largely been non-existent or hard to access as has been the case in the three industries I just mentioned.  If a Data Driven Solution can access, interpret, or create new data and use it to solve a big problem the market reaction can be like a starving person being offering a hot meal.    Castlight Health*, for example, solves the problem that in healthcare it is generally impossible to know what a given service (an office visit or a test for example) will cost until after you’ve consumed the service and you receive your bill 30 days later.  It turns out that the variance in pricing for even a commodity service like an MRI test can be 5 to 10x in a given 5 mile radius.  If one could know the price difference ahead of time they can consume intelligently–as we do in most other shopping situations.    Large employers, who tend to be self-insured, really like the idea of helping their employees spend less on healthcare as those savings drop straight to the bottom line, and as a result some of the largest employers in America have adopted Castlights’ solution.  Customers like CVS Caremark, Microsoft, and Wal-Mart don’t really care about the big data blahdy blah that Castlight uses to come up with their solution, they just know they are starving for ways to lower their employee health care costs and Castlight has an effective solution.

Vertical Strategy   While some industries are just getting their first taste of Big Data, others have been sophisticated handlers and miners of Big Data for a long time, such as the investment industry, airlines, and eCommerce.  In those fields a small incremental advantage afforded by a data driven vertical solution can be extremely valuable.  DataMinr* is a company that transforms the full Twitter stream of public tweets using sophisticated math to discern important news events amid all the noisy babble as quickly as possible ahead of the media.  Investment hedge funds will pay handsomely for incremental advantage and getting a jump on news that might move the market or a particular stock is something they are eager to buy even amidst all their number crunching sophistication and home grown solutions.  On April 23, 2013 when the stock market “Flash Crash” occurred based on a rumor that the Whitehouse was under attack, Dataminr’s algorithms figured out the attack was a hoax a full two minutes before other new outlets and their clients were able to act on the news ahead of the market’s rapid recovery from the severe dip the rumor had caused.  It turns out that news agencies like CNN, which typically rely on human reporters and shoe leather to beak news, have also turned to Dataminr as a solution to their problem.  Dataminr thus serves both a very sophisticated big data segment, investment funds, and an industry at the opposite end of the data automation curve, the news industry, with a solution that simply could not have existed until very recently.

Consumer solutions can be driven by data too  Using Uber is a magical experience.  Push a button on your phone and a car appears within an instant to take you where you want to go—no hailing, no reservations, no need to reach into your pocket for payment, and remarkably little waiting for your ride to arrive.  If Uber simply sent messages to available drivers about customers needing rides the system might still be good but customers would have longer wait times, which wouldn’t be as magical.  Instead, Uber uses statistical analysis on data coming from their drivers and riders to predict where demand will be highest and recommends that drivers congregate there to be ready for ride requests.  Nowhere in their marketing does Uber talk about data or “quantifying” your ride patterns—consumers don’t need to know how the magic happens as long as their ride shows up quickly.  Similarly, Better Finance* makes secured loans to consumers with low or no credit so they can buy smartphones and other high-value items.  Better Finance can do this at rates far less than payday lenders because of their data driven underwriting and feedback loops coming from high loan volumes and thus their underwriting algorithms constantly improve—to the benefit of Better Finance and their customers.  Opportunities to create consumer solutions enabled by big data are everywhere…just don’t mention the word data.

Traditional SaaS and on-premise software will be around for a long time in the future and these vendors will add more and more data intelligence to their offerings.  They will be joined however, and possibly threatened by, a new generation of nimble and innovative next generation SaaS companies that will combine data and domain expertise to add massive business value to their customers.

I look forward to meeting and helping as many of those companies as possible.

*Venrock is an investor in these companies.

Goldilocks and the 3 SaaS Go-To-Markets Models

25 Nov

Software as a Service (SaaS) is having its moment.  Customers, entrepreneurs, and capital markets are all enamored with the SaaS model– with good reason.  For customers, software as a service can yield dramatic reductions in total cost of ownership, quicker time to value, and pricing models which let you pay for only what you need and as you go versus all up-front.  For entrepreneurs, the recurring nature of subscription pricing gives more forward revenue and cash flow visibility, enables new customer acquisition models (such as Freemium), and the single code base for all customers is significantly easier to support than custom installs on-premise or supporting multiple generations of packaged software releases (and the Operating  Systems they run on.)  Investors love the predictable revenue, high margins and high growth rates.  This love affair with the SaaS model is likely to continue for a very long time. The vast majority of business software is still custom and/or on-premise license based, so there is more than a decade of disruption and growth ahead.

When we dive one fathom deeper into the SaaS model, however, we quickly discover that there is not one single model but at least three very distinct Go-To-Market archetypes.  At one end of the spectrum are the high-volume, low priced offerings such as Dropbox, Evernote, and Cloudflare that often deploy Freemium models, providing value to millions of individual users at no charge and converting some small percentage of them to premium paid accounts.    Workgroup collaboration and social/viral features are often built in to these products to help turbo-charge organic growth and online acquisition characterized by self-service signup and setup.  There are many entrepreneurs and investors who believe the whole point of SaaS is to get away from expensive direct selling in favor of these “self-service” models.  As an example, I was recently asked by an entrepreneur if I was in the “pro-sales or anti-sales camp.”  I am pretty sure they were referring to the need for salespeople, not sales themselves.  For the record, I like sales very much.

At the opposite end of the spectrum are sophisticated enterprise offerings such as Workday, Veeva and Castlight Health that are used by large enterprises and can justify pricing of millions of dollar per year.  There solutions are usually sold by experienced field sales teams, skilled in solution selling and navigating long and complex sales cycles.  These products are feature rich in terms of end-user capabilities but also in terms of security, administration and ability to integrate with legacy systems.

In the middle are solutions that usually charge tens of thousands of dollars to low hundreds of thousands per year and are sold largely over the phone by an inside sales team and can be reasonably configurable.  Customers may be medium sized companies or departments or business units of larger companies.  Examples of this model are Salesforce, Netsuite, Hubspot, and Smartling.

So which of these three models are best?  Is there one “just right” answer as there was for Goldilocks?  Or do we take the Three Bears perspective that as long as you line up the size of the chair, temperature of the porridge and firmness of the bed with the needs of your target market, all three models can be equally successful.   Clearly the latter, as one can point to several highly successful billion dollar market cap SaaS providers deploying each of the three models.  The key is to line up product/market fit, sales and support, and price in a consistent and appropriate fashion.

It should be noted that it is possible to expand across models over time, such as Salesforce.com who both sells over the phone to mid-market customers and also deploys a field sales teams to sell bigger deals to large enterprises.  Another example is Box.com which can be used by individuals, small teams, and large enterprises with pricing, feature sets and support options appropriate to each tier.

But what happens when the product, Go-To-Market strategy, and price are misaligned?  Here are the most common mistakes we tend to see:

Market too small or product too narrow for Freemium: Free is a very compelling price, especially when trying to entice consumers to try something new, and this model can certainly lead to lots of users relatively quickly.  However, employing this model in too small a market or with a product that lacks broad appeal faces the problem of there not being enough “top of funnel” free users from which some single digit percentage (typically) will convert to paying users to grow a sustainable business.  In B2B markets free can be a red herring as there ought to be enough ROI (return on investment) enjoyed by customers using your product, such that they will happily pay at least some minimal monthly payment.  Those business customers that don’t see such value likely won’t remain engaged over the long term as free users anyway.  Switching to a paid-only offering, perhaps with a brief free trial period or money back guarantee, can be an accelerant to SaaS companies if they make the change early enough to avoid the messiness of taking away a free service from your early adopters.  Some interesting case studies of SaaS offerings that saw their businesses grow rapidly when they dropped Freemium can be found here and here.  Even large SaaS companies in big horizontal markets such as DocuSign and 37Signals have greatly downplayed their free versions over time, in some cases removing them from the pricing pages of their websites, though customers can still find these free options offered if you search a little.

Underpowered and underpriced for large enterprise: We sometimes see impressive Fortune 500 logos on a customer list only to discover that the price points and deployments are quite modest.  These customers were acquired via heroic in-person selling efforts by the Founders and below market price points for non-strategic use cases.  The hope is usually  that this will catalyze “land and expand” proliferation, but unfortunately oftentimes the product is not sophisticated enough to deploy enterprise-wide or the sales team is incapable of selling at a price point that can ultimately sustain field sales efforts or a product roadmap necessary to serve large enterprise accounts.   While these “lighthouse” accounts are meant to serve as references upon which future inside sales efforts can draw credibility, the fundamental problem space can sometimes be too complex for effective phone sales to customers of any sizeAria Systems is a SaaS subscription billing provider that serves large enterprises and has found that to truly handle the needs of core business units within Fortune 500 customers requires a field sales team, sophisticated product feature sets, high touch support, and price points that can sustain such service levels.  Aria has left the opposite end of the market, serving small developers with an inexpensive and simple online billing service, to competitors that are better tuned to the broad low-end of the market and cannot compete with Aria for the narrower high-end of the market.

Overbuilding for long tail markets:  The opposite mistake from that just mentioned is trying to serve long tail markets with a product too complex and expensive for widespread appeal, leaving oneself vulnerable to much simpler, cheaper, easier to use products.  This is particularly true when marketing to developers where “cheap and cheerful” is more than adequate for most applications.  Stripe and Twilio have done a nice job of providing appropriately simple developer-centric solutions at the low ends of their respective markets, payments and voice/messaging services, stealing this opportunity from incumbent providers who were too expensive, too complicated, and too hard to do business with.

Too many flavors all at once: While true that established vendors like Cornerstore OnDemand and Concur can serve the spectrum from small business up to global enterprise, generally young startups lack the resources to serve multiple audiences at once.  Those that allow themselves to be pulled thin in multiple directions find they serve no segment particularly well and have cost structures that are unsustainable.  Better to nail one of the three basic models and let the market pull you emphatically up or down market as a means of successful expansion.   When are you ready to broaden?

My advice is to wait until you are sure that you are sufficiently up the Sales Learning Curve, that you are sure you can recoup your paid sales and marketing expenses in an appropriately short timeframe (usually a year or less) given your particular customer churn rate, margin profile and price points.  Once you are happy with your Customer Acquisition Costs (CAC) Payback  period, you can respond to market signals pulling you up or down market.  Likewise, I recommend making sure that your product is optimized for easy onboarding and support of the mid-market before adding sophisticated enterprise features to go upmarket or your development team may be overwhelmed and your user experience compromised.  In general there seem to be more examples of moving up market than down market.  It is fundamentally easier to add features and sales people to serve more sophisticated needs up market than to make a product simpler and master indirect channels to go down market.   When cooking porridge you can add salt, sugar and spice, but is much harder to take them away.

It’s a great time to build, buy or invest in Software-as-a-Service.  Recognizing that there are multiple, distinct Go-To-Market models, each equally valid in the right circumstances, enables a clear-eyed and internally consistent strategy that avoids the mistakes describe above and captures the high level benefits of SaaS.

Slide1Note:  Companies in italics are Venrock portfolio companies.  


The single best financial reporting tool ever

18 Jan

Today I faced a choice.  Should I go out and enjoy the beautiful weather and waves and go for a surf or should I blog about my favorite financial reporting tool?  Seems like a pathetic question for a surfer to ask, or maybe this financial reporting tool is really that great.  I’ll settle for an answer of “both”.

The tool in question is the Waterfall Chart.  It’s a way to compare actual results across time periods (months or quarters usually) against your original Plan of Record, as well as forecasts you made along the way as more information became available.  It packs a ton of information into a concise format, and provides management and Board members quick answers to the following important questions:

1.      How are we doing against plan?  Against what we thought last time we reforecast?

2.      Where are we most likely to end up at the end of the fiscal year?

3.      Are we getting better at predicting our business?

The tool works like this:

Across the top row is your original Plan of Record.  This could be for a financial goal like Revenue or Cash, or an operating goal like headcount or units sold.  Each column is representative of a time period.  I like monthly for most metrics, with sub-totals for quarters and the full fiscal year.  Each row below the plan of record is a reforecast to provide a current working view of where management thinks they will wind up based on all the information available at that time period.  Click the example below which was as of August 15, 2010 to see a sample, or click the link below to download the Excel spreadsheet.

click to enlargeWaterfall Report spreadsheet

Periodic reforecasting does not mean changes to the official Plan of Record against which management measures itself.  Reforecasts should not require days of offsite meetings to reach agreement.  It should be something the CEO, CFO, and functional leaders like the VP Sales or Head of Operations can hammer out in a few hours.  Usually these reforecasts are made monthly, about the time the actual results for the prior month are finalized.  When you have an actual result, say for the month of August, $2,111 in the example above, this goes where the August column and August row intersect.  On that same row to the right of the August actual you will put the new forecasts you are making for the rest of the year (September through December.)  In this fashion, the bottom cells form a downward stair step shape (a shallow waterfall perhaps?) with the actual results cascading from upper left to lower right.  You can get fancy and put the actuals that beat plan in green, and those that missed in red.  You can also add some columns to the right of your last time period to show cumulative totals and year to dates (YTD).  With or without these embellishments you’ve got some really powerful information in an easy to visualize chart.

Two questions an entrepreneur might ask about this tool:

By repeatedly comparing actual to plans and reforecasts, won’t my Board beat me up each month if I miss plan or even worse, miss forecasts I just made? If you are a relatively young company, most Board’s (I hope) understand that planning is a best-efforts exercise not an exact science.  Most Boards will react rationally and cooperatively if you miss your plan, as long as you avoid big surprises.  By giving the Board updated forecasts you decrease the odds of big surprises because the latest and best information is re-factored in to the equation as the year progresses.  They probably won’t let you stop measuring yourself against the Plan of Record, but at least you’ve warned them as to how results are trending month to month and course corrections can be made throughout the year.

Won’t this take a lot of time? Hopefully not a ton, but it does take effort.  However, it should be effort well worth it beyond just making the Board happy, because as a management team you obviously care about metrics like cash on hand, and this should be something you are constantly recalibrating anyway.  The waterfall is the perfect tool to organize and share this information.

Most of my companies using this tool track five to ten key metrics this way.  Typical metrics include:

  • Revenue
  • New bookings
  • Cash on hand
  • Operating expenses
  • Net income
  • Headcount
  • Units sold or new customers acquired
  • Some measure of deployed/live customers (if there is a lag between a sale and a live customer)
  • For internet companies, some measure of the “top of the funnel” such as Unique Visitors or Page Views

Whether or not you agree this is the single greatest financial reporting tool ever, I hope you give it a try and find it useful.  Now I’m going surfing….

Why Are VCs So Scared of Hospitals?

8 Nov

There is much conventional wisdom in venture capital.  One such belief is that hospitals are a really horrible market for tech startups to pursue.  Back in 2002 when we invested in Vocera, an innovative communications system for hospitals (think Star Trek), many other firms had looked at the deal and passed.  Although this was the company’s third round of financing, the company was still pre-revenue and pre-launch, and this was the first round raised subsequent to their strategic shift from a horizontal solution to one vertically focused on hospitals.  Most VCs ran from it.  Following are some of the reasons potential investors gave for hating the hospital market then, most of which persist as concerns, often valid, today:

1.      Hospitals are highly budget constrained

2.      Most hospitals don’t have profits motives and are not subject to the same competitive forces as for-profit businesses

3.      Hospitals are complex political environments with many forces that influence decision making and purchase behavior that seem counter to rational business judgment.  Those who decide, those who approve, those who pay, use, benefit from, can all be different roles in the organization.

4.      Sales cycles are very long, often measured in years.

5.      Hospitals are technology laggards when it comes to adopting information technology.

6.      Hospitals are dominated by large technology vendors such as GE, Cerner and IBM.

There is some truth to each of these, but here’s the counter argument that led us to make a second investment in the hospital market, namely Awarepoint, an indoor GPS system for tracking people and assets in the hospital.

1.      There are lots of hospitals.  Over 5500 in the US alone, and there are little blue signs pointing you to each of them.  Given the annual budgets of your typical hospital, this translates into a very big market.  Vocera now serves over 650 hospitals and more than 450,000 daily users, and is still growing very rapidly, believing they have tapped less than 10% of their core market opportunity.

2.      Hospitals are sticky.  Once your product is adopted, and assuming it works well, they are reluctant to switch you out because solutions get so enmeshed in different processes and systems, and so many employees get used to them.  You can’t screw up, or raise prices dramatically, but you may not have to sing for your supper every time a competitor issues a press release.

3.      Hospitals are willing and able to spend on IT if it is a priority and they see an opportunity for a large return on investment.  This is one of the things helping Awarepoint penetrate the market, and they are not alone. Companies like Allocade , which creates dynamic patient itineraries to improve throughput, are also having success based on the ROI they can deliver.

4.      Because hospitals are underpenetrated by information systems, there is lots of low hanging fruit and relatively basic problems to be solved.  Electronic Medical Records vendors are having a field day, both because of stimulus incentives but because many hospitals, especially the 72% of all community hospitals with under 200 beds, still don’t have this basic form of digitizing their information.  The trend towards Accountable Care Organizations, and the related financial incentives, will require greater clinical integration of care across health care settings (inpatient, ambulatory), greater financial efficiency, and increased transparency and flow of information about the process, costs, and outcomes of health care, all of which will require better healthcare information technology.

5.      Hospitals are similar to each other and willing to serve as references to each other.  Yes, they do compete in some ways, and each has its unique attributes, but you find a higher degree of collegiality and similarity than most industries where competitors hate each other and each may have very different ways of doing their core activities.

There are a few reasons why the hospital market is ripening for startups and the VCs who love them:

1.      Hospitals are feeling financial pressures to run efficiently.  With healthcare reform there will be more patients coming in their door requiring services, while price caps will get tougher.  And there will be financial penalties for things like readmission rates that often correlate to operating inefficiently, and which technology can help prevent.

2.      With the EMR mandates and installations, the Chief Information Officer is now in an elevated position in the organization and even considered a revenue generator.  Many EMR installation projects are leading to ancillary projects and opportunities to automate and digitize other aspects of hospital operations.

3.      New IT paradigms like cloud based services, open data initiatives (thank you Todd Park @ HSS), APIs, and Open Source means that it is less expensive to build and deliver better products into the hospital.

4.      Wireless technologies, and relatively cheap and robust devices like iPhones and iPads, make it easier to reach caregivers on the go, whether nurses at the bedside or Doctors on the golf course.  Companies like AirStrip are getting real-time info to the caregiver wherever they are, and caregivers love it.  Also, WiFi and Zigbee in the hospitals means your equipment and monitors, and even staff, can transmit their info from wherever they are without wires and expensive, disruptive installations.

5.      This current generation of Doctors and are used to technology in their personal lives.  They use email, carry iPhones and Blackberries, shop online, etc.  And the residents entering hospitals today are Digital Natives.  There will be an increasing expectation that hospitals adopt these technologies that most other verticals have embraced.

While we fear the unexpected visit to the hospital as much as anyone, Venrock is looking forward to more investments in companies that serve them with compelling HCIT solutions.

Building Healthcare IT Companies: 11 Insider Insights

5 Oct
This blog post was a collaboration with my Venrock colleague Bryan Roberts, who in addition to being a great bio-tech and medical device investor, was also an early lead investor in athenahealth, and currently on the Board of Coderyte and Castlight, two really hot HCIT companies.

Having participated in healthcare IT for the last 10+ years, we decided to collect and share some lessons learned. The list is by no means exhaustive, so let us know your thoughts – where you disagree, what you would add, etc.

  1. The product must be a true “have-to-have”, not a “nice-to-have”. Any healthcare IT product needs to solve an important problem for a defined customer base (providers, payors, patients) and this is where lots of companies go astray. The product needs to help someone enough for them to be compelled to adopt it, while they are busy worrying about a lot of other things, and it is not enough to have a product that helps out the “system”. If you can’t convince yourself that it is one of the top three things that your specific customer is concerned with, forget it.
  2. Healthcare is actually an aggregation of many small “markets”. While the overall healthcare market is measured in billions – if not trillions – very few needs, ideas or businesses can span the entirety. Many companies/ideas are only applicable to a subset (breast cancer, arthritis, heartburn, etc.) of healthcare or require significant re-work as one moves from one disease area to another – think content for different diseases. This dynamic also substantially impacts some of the revenue stream opportunities and the critical mass needed to make a business viable. For example, pharma advertising for a given drug is targeted at patients with a specific disease, not all healthcare consumers, and so the number of overall users needed to amass a specific target population and access that ad revenue, is many multiples of that target market.
  3. Start-up revenue streams and value propositions are elusive. There are lots of potential revenue streams in healthcare, but many are only accessible to a business that has hit scale (perhaps $100MM revenue) and critical mass creates an ecosystem such that the network has value above and beyond the interaction between the individual customer and the product. This is especially true for advertising and data revenues, but also for lead generation and others. It is much simpler to create viable revenue streams when your business reaches a substantial size than it is to find the revenue stream that gets you from $0 to $50MM… So think hard about the value proposition and revenue stream for the start-up phase of your business before you hit critical mass and dominate a space.
  4. Customers must have more money with your product, than without it. There is no room for broad adoption of products that are a financial drain. Remember that every participant in the healthcare system is strapped for cash – hospitals are lucky to run a profit, doctors’ earnings have decreased consistently over the last decade and patients are used to “free” healthcare. You have to offer hard, demonstrable ROI. You can get away without it for a small number of leading edge customers for a while, but the primary goal of those customer engagements must be to get the ROI data that will be necessary to support broader customer engagement. Adding another cost, even with a long-term ROI is very hard.
  5. Businesses with strong network effects are gold mines. Given that healthcare has complex problems and customers are tough to secure (long sales cycles), a network effect can solidify a first mover advantage and continually decrease sales cycles, as well as afford sub-5% annual churn rates. Happily, the healthcare industry is ripe to create businesses with network effects given the historical underinvestment in the space and the proliferation of “big data” business opportunities. Every customer should benefit from the cumulative customer base, with each subsequent customer deriving and creating more value than prior customers.
  6. The customer is mobile. Unlike many verticals, most health care providers do not sit at their desks all day; they are doing rounds and moving between exam rooms or even buildings. Meanwhile, consumers are making decisions that impact their health (eating choices, exercise, lifestyle) while out in the real world, living their lives. This situational complexity cuts both ways. On the one hand it makes some traditional enterprise strategies more difficult, while on the other, especially when combined with the proliferation of smart wireless devices, it creates opportunities for a new breed of mobile healthcare applications not seen previously.
  7. Expect to have a service component to your business, but avoid becoming a customized consulting shop. Healthcare is complicated and confusing, and although technology may solve a multitude of problems, it will require some handholding and take time. There is nothing approximating shrink-wrapped software in healthcare – and you want to use the service component of your business to help improve your software product. There is a virtuous cycle between the software and service. On the other extreme, the technology infrastructure should not be stove piped or custom-built for each individual client, even “marquee” clients. In healthcare, for a variety of reasons, there are significant pressures to bring your technology infrastructure directly under the thumb of the customer—the servers, the code, the management of the upgrade schedule, etc. Try to resist these pressures and ensure that you build a common chassis that you own with “plug-ins” for individual clients as needed.
  8. Beware of businesses dependent upon heroics…Make it easy. The healthcare sector is a notorious technology laggard, and for good reason. The environment can be chaotic, collaboration is complicated and staffing is convoluted. Simplicity is key with user interfaces and alerts are essential. For businesses targeting health systems, if your business depends on the brilliance, creativity and bandwidth of hospital IT, think again. Hospital IT is massively overworked and understaffed and has a list of number one priorities a mile long. The perfect solution for hospital IT is one that requires little or no effort on their part. For business targeting consumers, it’s dangerous to assume that consumers will wake up and start taking better care of themselves. Consumers will eventually start taking better care of themselves, but it is unlikely to occur before you run out of cash.
  9. Know your domain. Healthcare IT is neither healthcare nor IT. Concepts and actions that traditionally work in each of those established spaces can run afoul in Healthcare IT. Navigating this sector is complicated – from a regulatory perspective, privacy, relationships, etc.
  10. Secure customer references and studies. Winning “lighthouse” accounts, such as the prestigious clinics and teaching hospitals (Mayo or Johns Hopkins), can be great validation for your product or service. These customer references will earn you respect, but unfortunately many customers will look at those institutions as fundamentally different from their own situation (whether based on size, financial resources, scope, etc) and thus not relevant as case studies. Often you will need multiple, credible local references in each geography before you can enjoy the efficiencies of reference selling. Same goes for ROI and effectiveness studies.
  11. Do well by doing good. Healthcare can be viewed as a business or a calling, but the most successful ventures view it as both. It is hard to beat an entrepreneurial team that is powered by the dream of both financial and social rewards. So strive to create value across the board (customers, investors, community).